vinSight Dashboard User Guide - Part 1
Welcome to vinSight Dashboard
The vinSight Dashboard is your comprehensive sales analytics tool designed specifically for winery direct-to-consumer (DTC) sales. This guide will help you understand and navigate the dashboard to make informed business decisions.
Getting Started
System Requirements
- Recommended Browser: Google Chrome
- Data Refresh: Dashboard data is refreshed daily overnight
- Access: Account Owner will have default permission; anyone else will need vinSight access turned on for their role. You will only see data for your winery
- Data: starts from 2024+
- Default date: for the report is the last 12 months
Dashboard Overview
The vinSight Dashboard provides a complete view of your sales performance, including revenue, customer behavior, product performance, and operational metrics. All data is interactive?clicking on any element will filter the entire dashboard to help you drill down into specific insights.
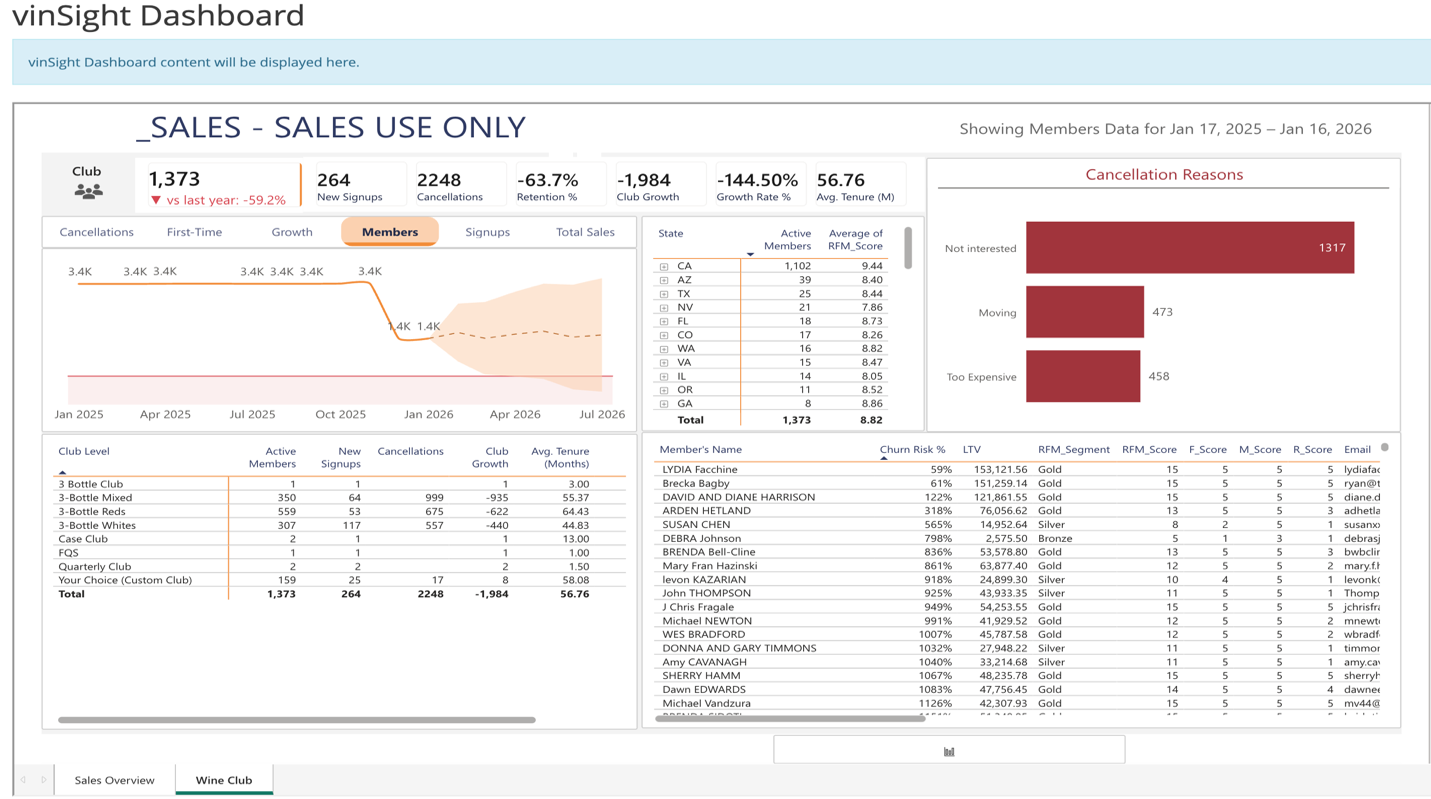
Understanding Key Metrics
Top Performance Indicators
At the top left of the dashboard, you'll see three primary metrics:
Net Sales
- Total revenue for the selected period
- Shows dollar amount and percentage change vs. last year
- Green percentages indicate growth; red indicates decline
Volume (L)
- Total wine volume sold in liters
- Includes year-over-year comparison
- Helps track physical product movement
Club
- Total number of wine club members
- Tracks membership growth or decline vs. last year
Additional Metrics Explained
Refund Amount: Total refunds processed (shows "--" when no refunds occurred)
Tip Amount: Total tips received (shows "--" when no tips were recorded)
Discount %: Percentage of sales discounted
Bottles Sold: Total number of bottles sold
Total Orders: Number of individual transactions
AOV (Average Order Value): Average dollar amount per order (Total Sales ÷ Number of Orders)
New Signups: New wine club member enrollments
Cancellations: Wine club membership cancellations
Retention %: Net change in membership, calculated as (New Signups - Cancellations) ÷ Total Members
Volume 9L: Total volume expressed in 9-liter case equivalents (industry standard measurement)
Navigating the Dashboard
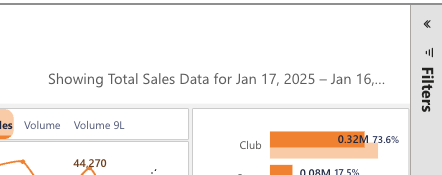
Date Range Selection
The dashboard displays a date range at the top right.
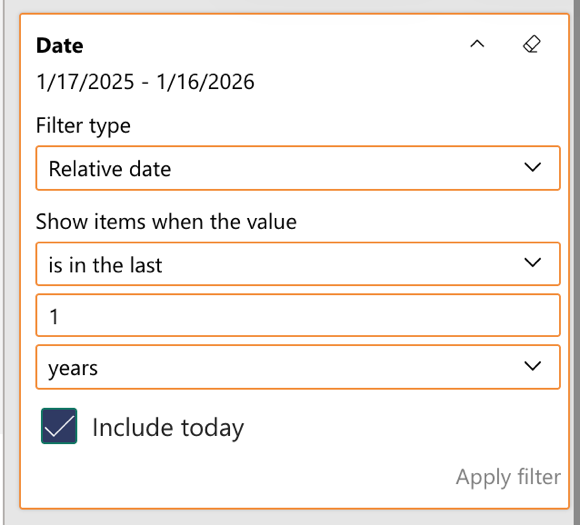
To change the date range:
- Click on the Filters icon in the top right corner of the dashboard
- In the "Filters on all pages" panel, locate the Date section
- You can set filters using:
- Filter type: Choose "Relative date" for dynamic ranges
- Show items when the value: Select time period (e.g., "is in the last")
- Enter the number and unit (years, months, days)
- Check "Include today" if you want current day included
- Click Apply filter
Clearing All Filters
To return to the default view and remove all active filters:
- Click the "Clear selections" option located just below the date range at the top of the dashboard. This is a tool tip, you need to mouse over this area for it to pop up.
Continue with Part 2 - 6 below
Part 1 of 6 | Last Updated: January 2026